Case study · Railways

Data Warehouse for Rail Defectoscopy

Context

Railways of the Slovak Republic ordered a diagnostic vehicle for non-destructive testing from a consortium of companies, which delivered the vehicle, measuring technologies, and the software to evaluate all the measured data. For this consortium, we created a warehouse and an analytical tool that displays the data in a user-friendly portal.

JavaSpring StackVue
Campaigns
Campaigns
Campaigns
Campaigns
Campaigns
Campaigns
Dashboard
Dashboard
Reports
Reports
Reports
Reports
Problem definition and goal

Measurement systems produce a huge amount of data, which needs to be transferred to a datastore and later cleaned and transformed into a format understandable to a common user. Due to the size of the database, which is estimated to be ca. 5TB, the data must be transformed into a format that is optimized for future display on the portal. The application must provide a user interface that displays the requested data with fast response times and is able to present the measured data on an underlying map.

Industry
Railways
Competencies
Data analyticsData visualizationData warehouseHigh data volume processingMicroservices
Technologies
JavaSpring StackVueREST

Challenges

The project involves a large volume of measured data that needs to be transferred from a locomotive to a server, then cleaned and transformed into a format that enables later data analysis and provides short response times for the presentation layer.

  1. Cooperation of multiple vendors

    One of the challenges was also to arrange cooperation among several companies, including multiple vendors of measuring systems and multiple vendors of software solutions.

  2. About the customer

    Railways of the Slovak Republic manages the state-owned railway infrastructure on the territory of the Slovak Republic and at the same time provides also transportation services.

Solutions

The data warehouse consolidates vast amounts of information collected from measurement systems installed on the locomotive. This warehouse efficiently stores, cleans, and transforms raw measurement data into a structured format, enabling comprehensive analysis and reporting. It supports advanced data analytics, facilitating the identification of rail defects, trends and patterns over time.

Campaigns

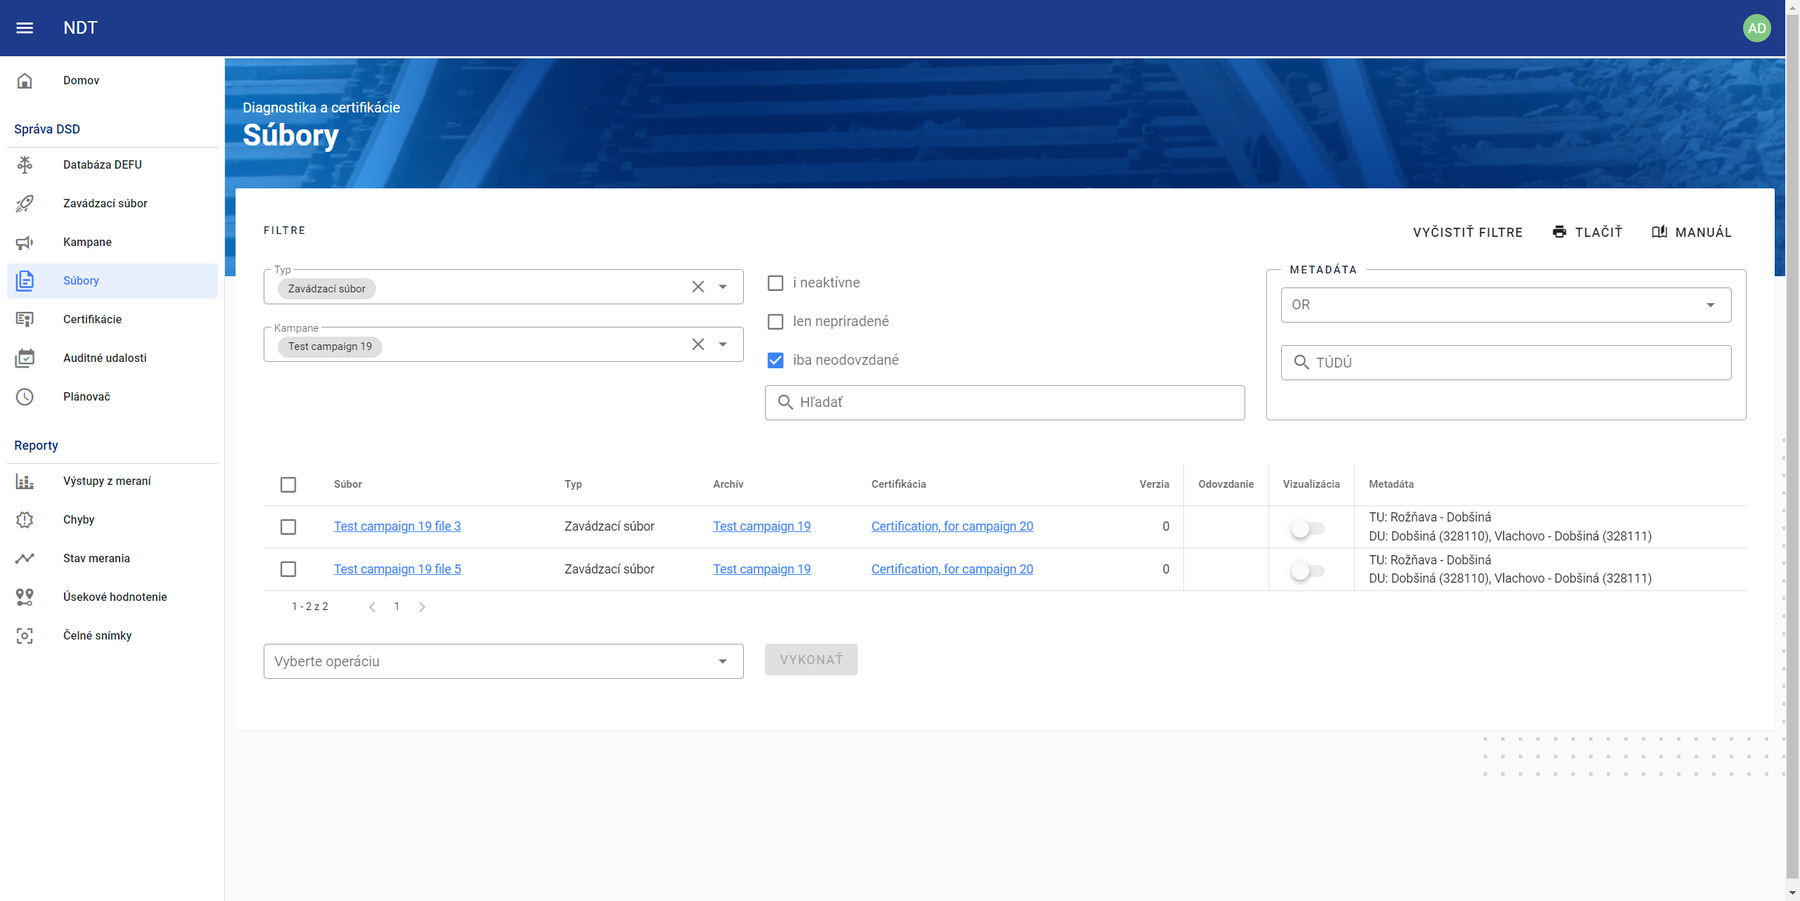
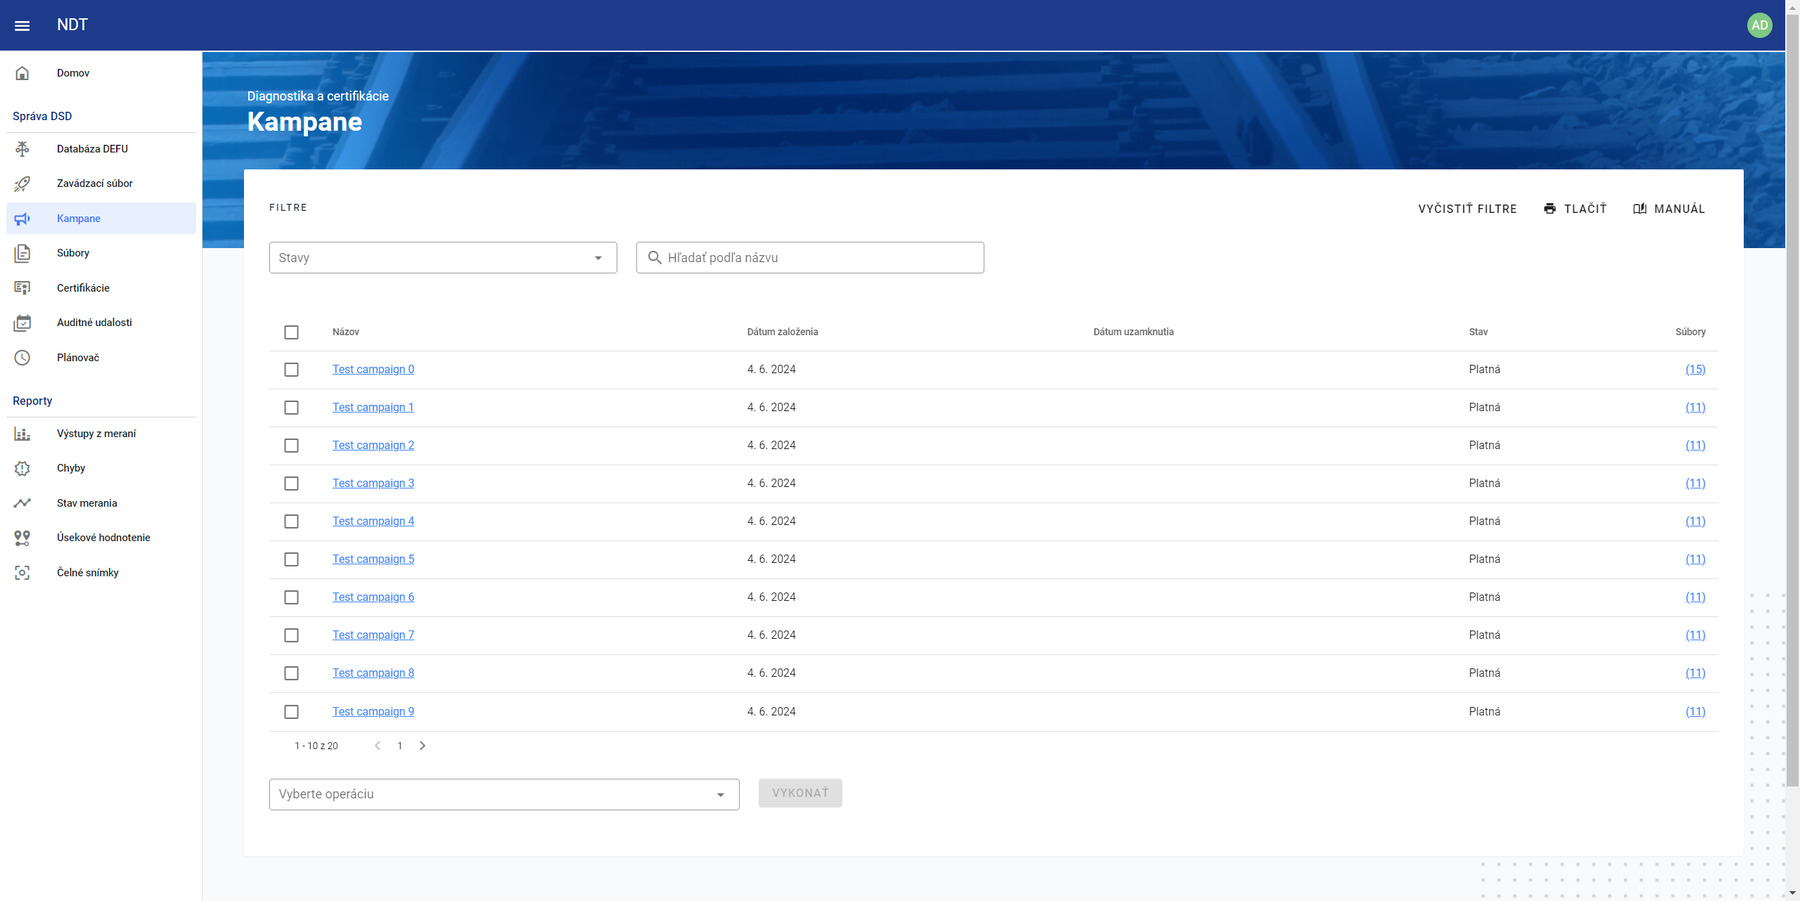
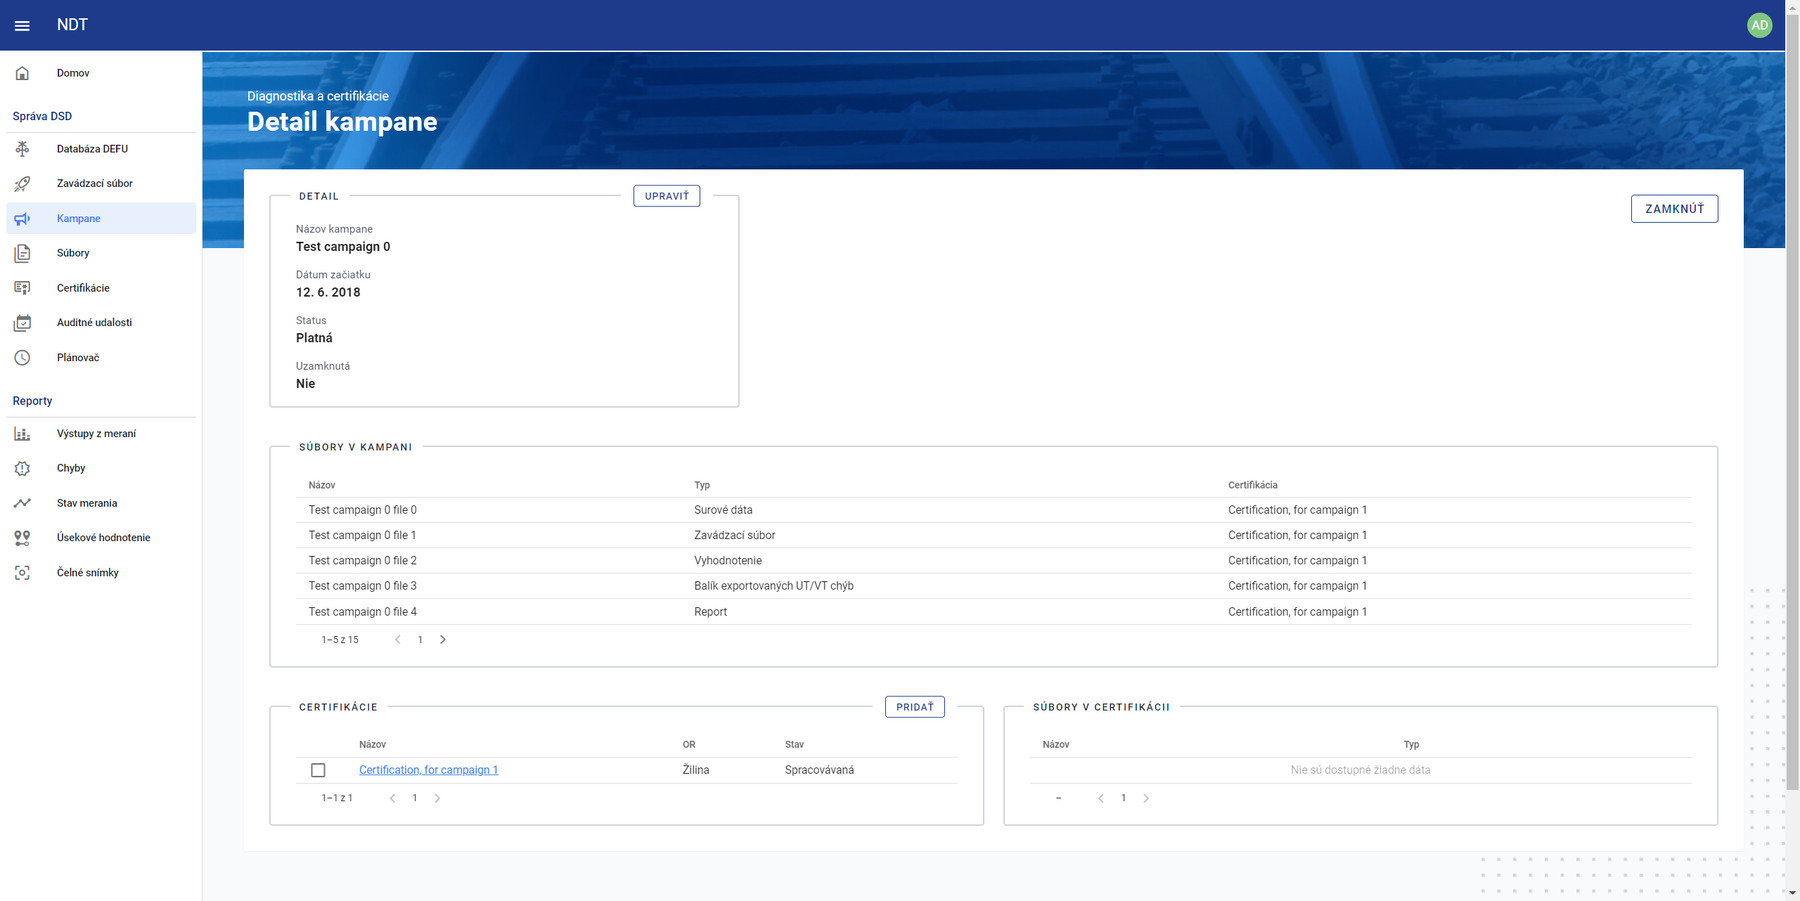
The measurements of selected track sections are planned in advance as part of a measurement campaign. When creating a campaign, a user has to define the entire route plan for the diagnostic vehicle, including details regarding the vehicle's speed, types of diagnostics, and scheduled stops at stations.

After completing a campaign, a user can view and analyze the collected data. It is possible to download the original files produced by the measuring systems, view pictures or videos from cameras, and locate the defects on a map.

Campaigns and all associated files have their own lifecycle, which helps users to analyze the results and plan subsequent repairs.
Dashboard

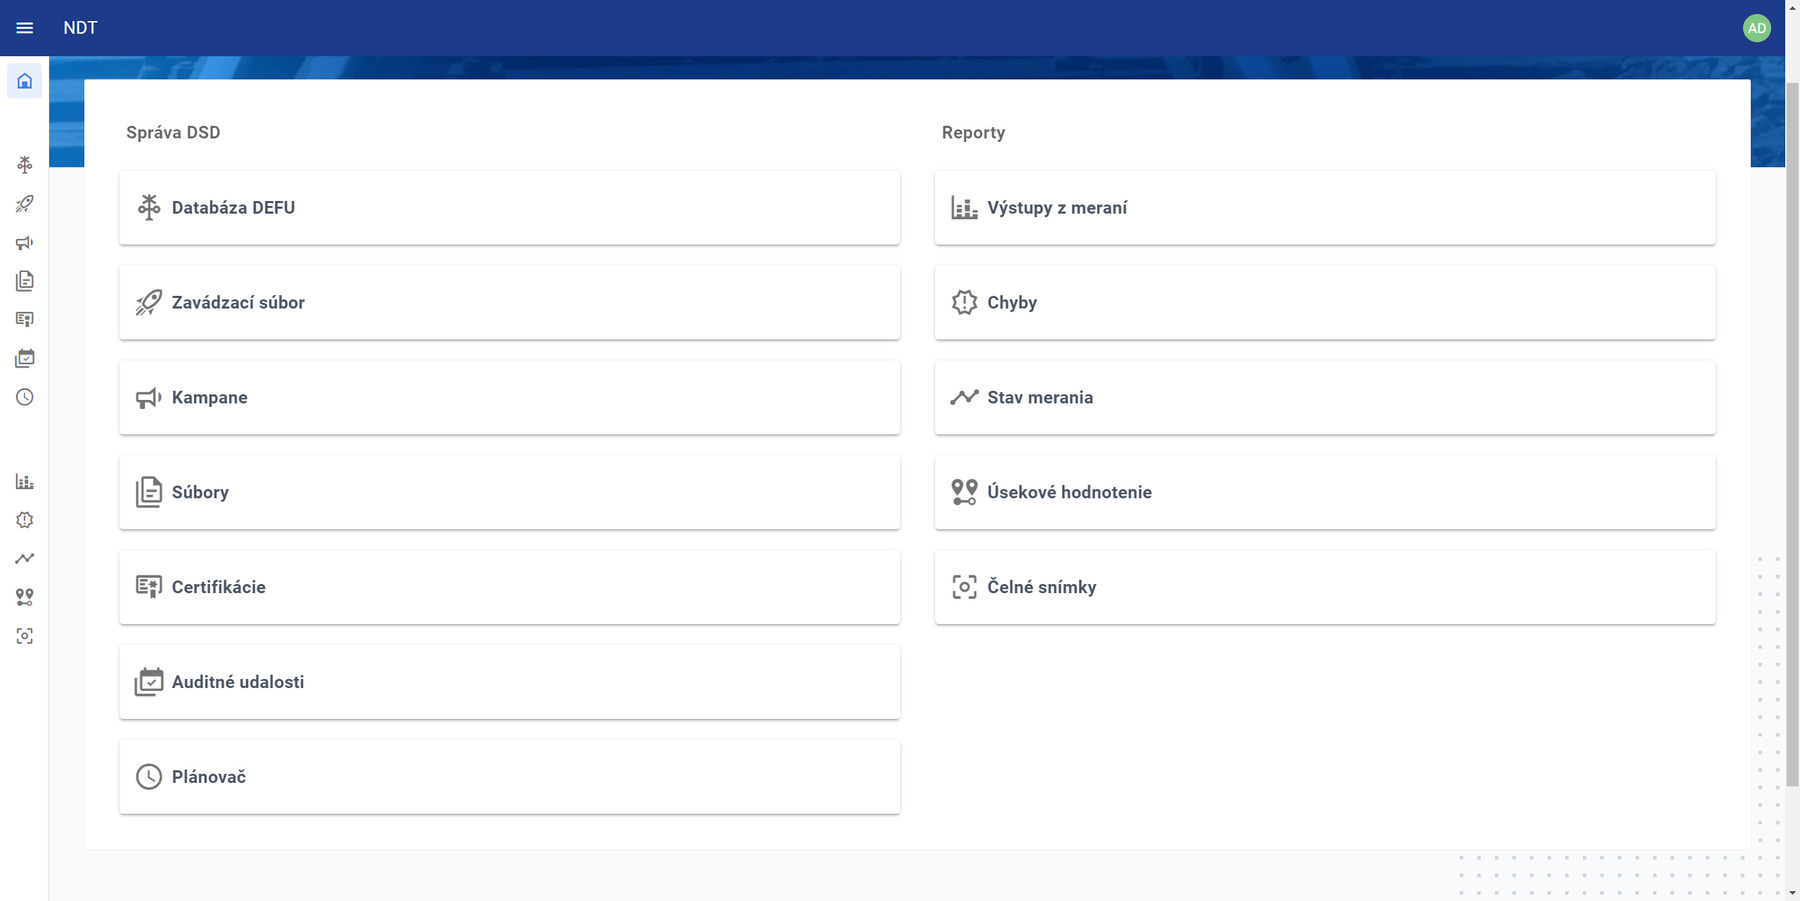
The application features a comprehensive dashboard with interactive tiles, allowing users to easily navigate to various screens such as reports, campaigns or files. Each tile provides quick access to different functionalities, ensuring an intuitive and efficient user experience. The dashboard serves as the central hub, offering an overview of key information and functionalities. Users can access detailed reports, manage campaign data, and navigate to all other screens directly from the dashboard.

Dashboard

Reports

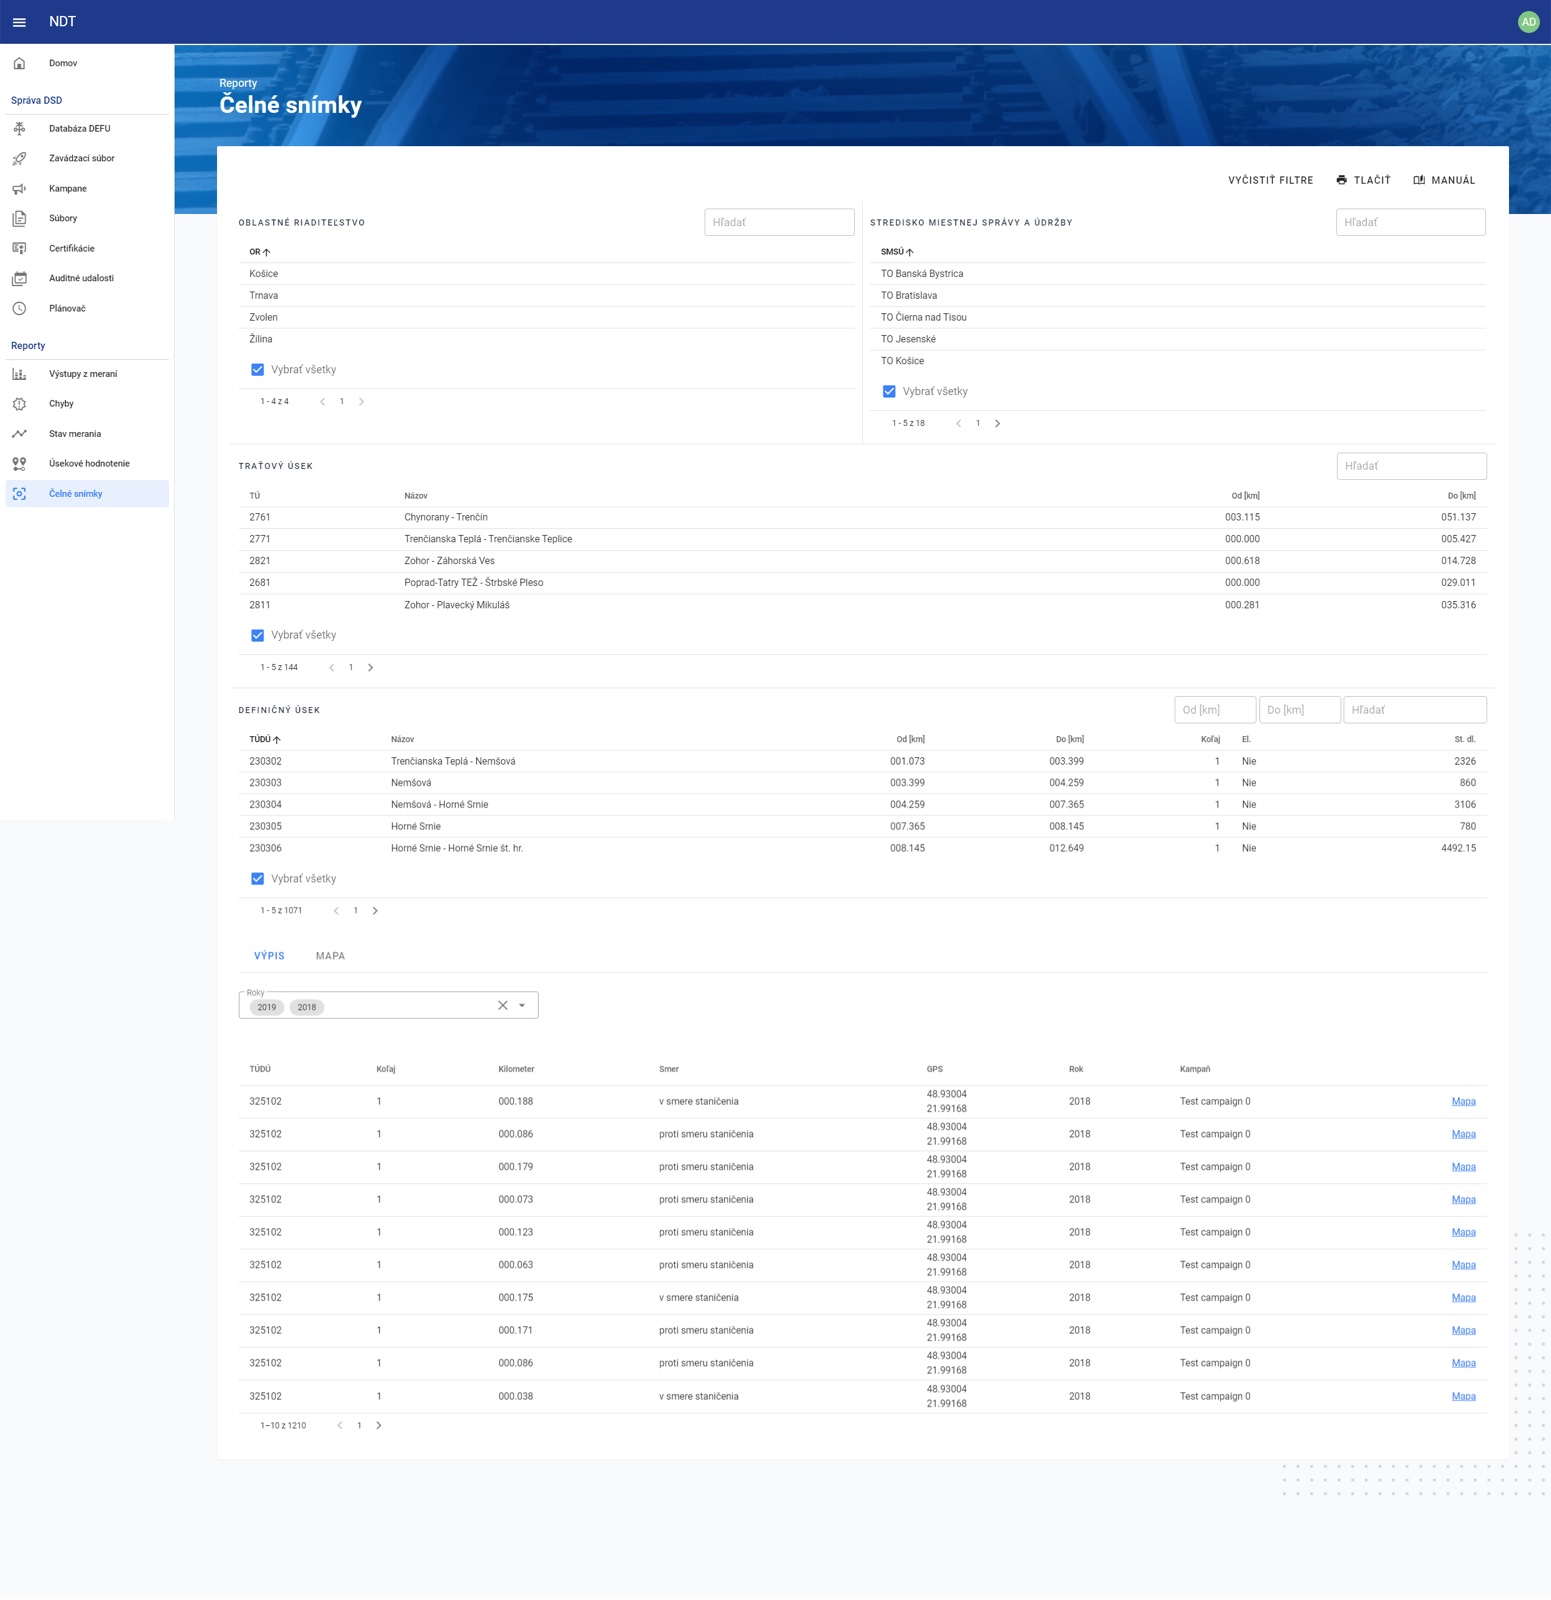
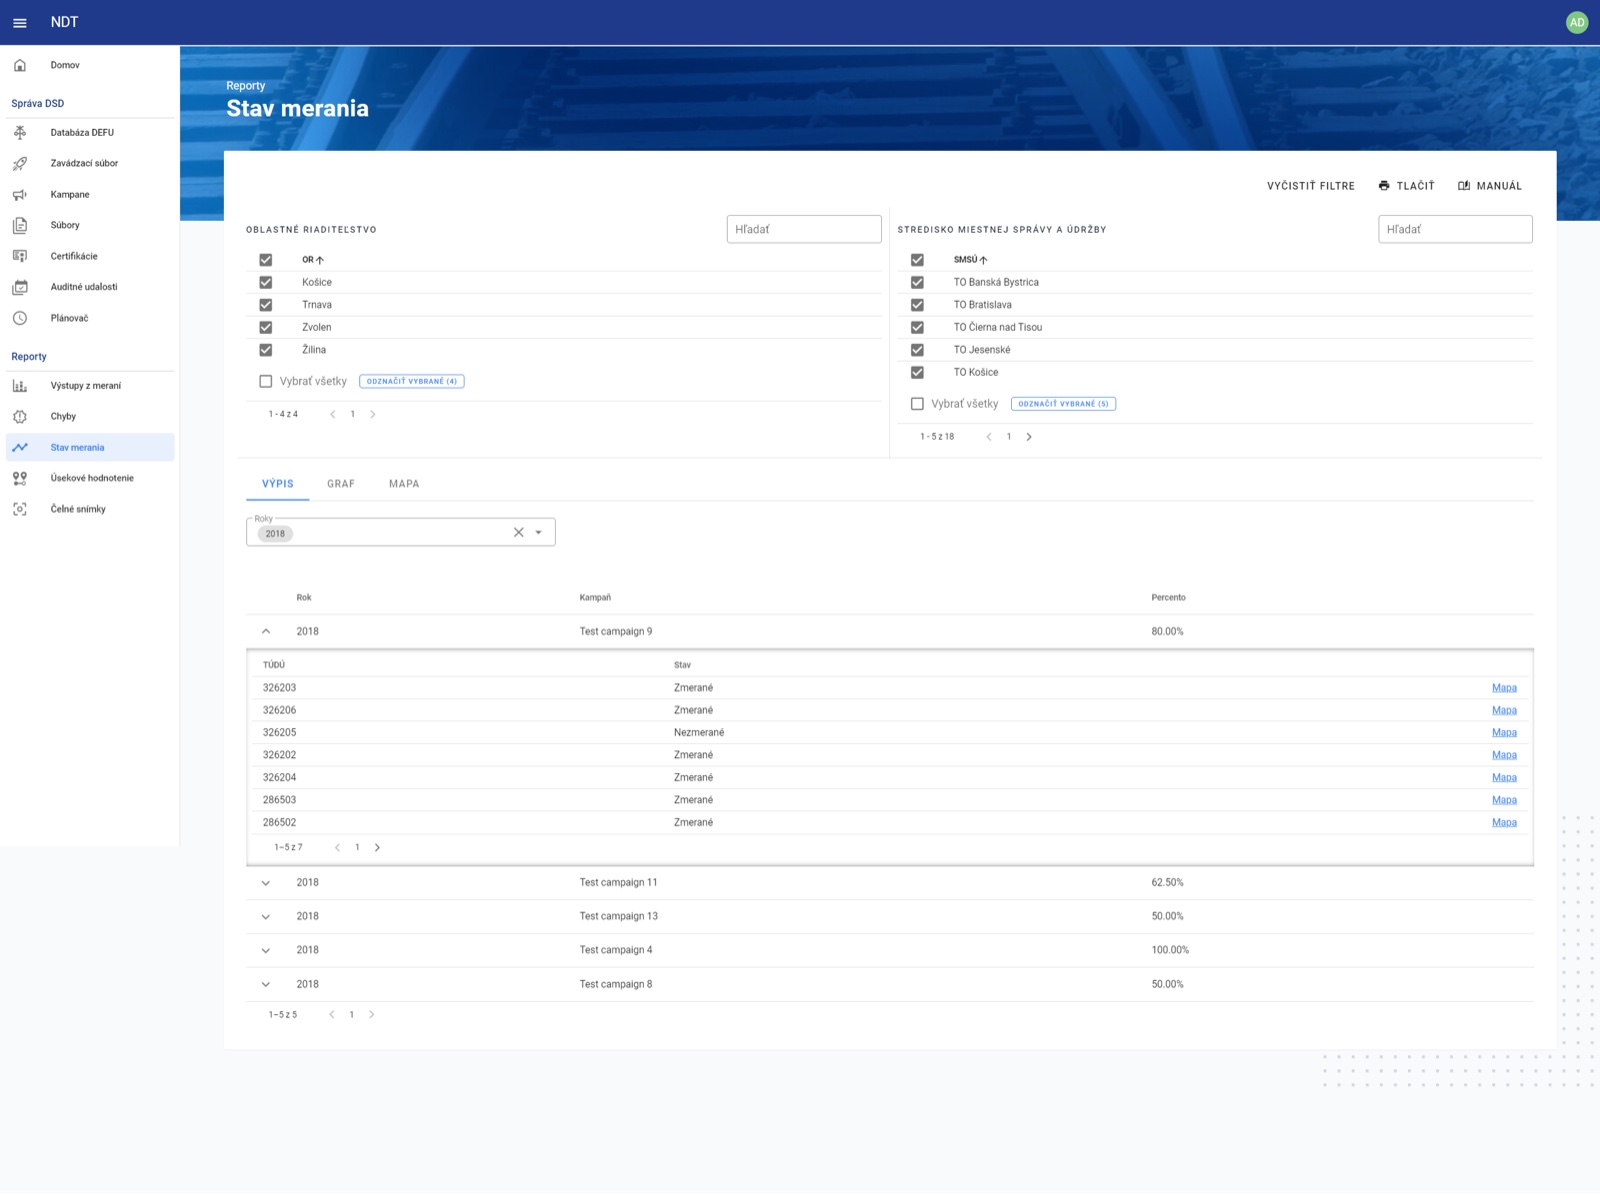
The application includes a variety of reports to support comprehensive data analysis and decision making. These reports encompass outputs from measurements, detailing precise data collected during campaigns. Error reports highlight any anomalies or issues detected in the data. Sectional assessment reports provide an evaluation of specific track sections, while status of measurement reports offer real-time updates on the progress and results of ongoing measurements. Additionally, frontal photo reports present visual documentation from cameras, aiding in the identification and verification of defects. Each report is designed to provide clear and actionable insights, enhancing the overall efficiency and effectiveness of the rail maintenance process.

Key features

  • Data analytics
  • Data visualization
  • Data warehouse
Is this for you?

Your measurements pile up. Your decisions shouldn’t wait.

We built the data warehouse and analytics portal for a rail diagnostic vehicle used by Railways of the Slovak Republic. The same problem appears wherever measuring systems produce more data than people can read.

  • Railways and transport infrastructure
  • Energy and utility networks
  • Roads and bridges
  • Industrial monitoring
Sounds familiar?

0 of 5 sound familiar

How we would start

  1. Agree on the data flowFrom each measuring system into one store. On the rail project that meant around 5 TB of data.
  2. Shape the data for displayTransform it into a format optimised for fast responses in the portal.
  3. Give people the views they needMeasurement campaigns, a dashboard and reports, with the measured data on a map.
Drowning in measurement data?

Tell us
about your project

Describe what you want to build. We’ll get back to you within 24 hours with a proposal for next steps.

Need more info?

Reach out directly to our project managers, who will be happy to tell you more.

Romana Kovalová