Case study · Telecommunications

SIA – Service Impact Analysis

Context

SIA is an evolution of our previous project CELINE which goal was the integration of various inventory data sources into one application. Although CELINE was developed for Orange France, the project caught the attention of the whole Orange group. In particular, Orange Slovakia came up with a requirement not only to integrate their inventory-related data source but to use this data to answer seemingly simple questions: What would happen if a particular network element experiences an outage? Which services and customers might be affected and how will the outage spread through the network? We have developed SIA to answer these questions.

JavaSpring StackPostgreSQL
Find relations across huge graphs in real-time
Complete the missing data
Impact visualization
Problem definition and goal

There are three situations when a user needs to aggregate a lot of data to find the answer about the potential impact on customers and their products.

  • In case of planned network element upgrade, decommissioning, or any change which might affect its functionality
  • In the case of device outage identified by operation teams and monitoring tools
  • In case of customer complains about service malfunction

In all of these situations, many users had to collaborate, access many tools, and compile the results to find the corresponding answer. This process is error–prone and in more complicated cases (e.g. decommissioning of metropolitan optical cable) might take two weeks to finish.

Industry
Telecommunications
Competencies
Data integrationData modelingMicroservicesDistributed applicationsHigh data volume processing
Technologies
JavaSpring StackPostgreSQLApache LuceneVueVuetifyNeo4jChevrotain

Challenges

We had to face the same challenges as in the CELINE project. This project moves the requirement even further and thus a new set of challenges in addition to those from CELINE.

  1. Find relations across huge graphs in real-time

    If you want to calculate all services which rely for example on a given metropolitan optical cable, you not only need high quality and strongly correlated data but you will also need to inspect large parts of the network both vertically and horizontally. The problem with such reports is also that you don’t know how “deep” you need to search.

  2. Complete the missing data

    Although successfully correlating data from all existing inventory systems and all network management systems in Orange Slovakia, there still were gaps which we had to fill to have the full picture of the network. For example, no data source would describe service architecture in the detail of particular network elements.

  3. Impact visualization

    The requirements were to provide a list of services and customers impacted by network element outages. This list is used for example to inform customers about planned outages. Even if we would have had the list, then the question of “how could the user validate that the list is correct?” would arise. Another question we had to keep in mind was “how could the user understand what is the chain of the outage which results in an impact on this particular customer?”.

Solutions

Luckily, we had already a production system in place and a lot of experience in the domain of telecommunication inventory integration from our previous project CELINE. We decided to reuse our solutions and code. Also, we further used this opportunity to modernize our code stack, refactor important parts which would later become more optimized, and created a better product for both CELINE’s and SIA’s use-case.

Find relations across huge graphs in real-time

We have decided to continue using our standard relational database as our main persistent storage. However, to be able to search in the huge graphs in real-time, we have introduced a specialized graph database, NEO4J, which greatly enhanced our possibilities in performing analyses of the telecommunication network. The data in NEO4j are synchronized from our main persistent database and are de-normalized and enhanced to further speed-up the network impact analyses.
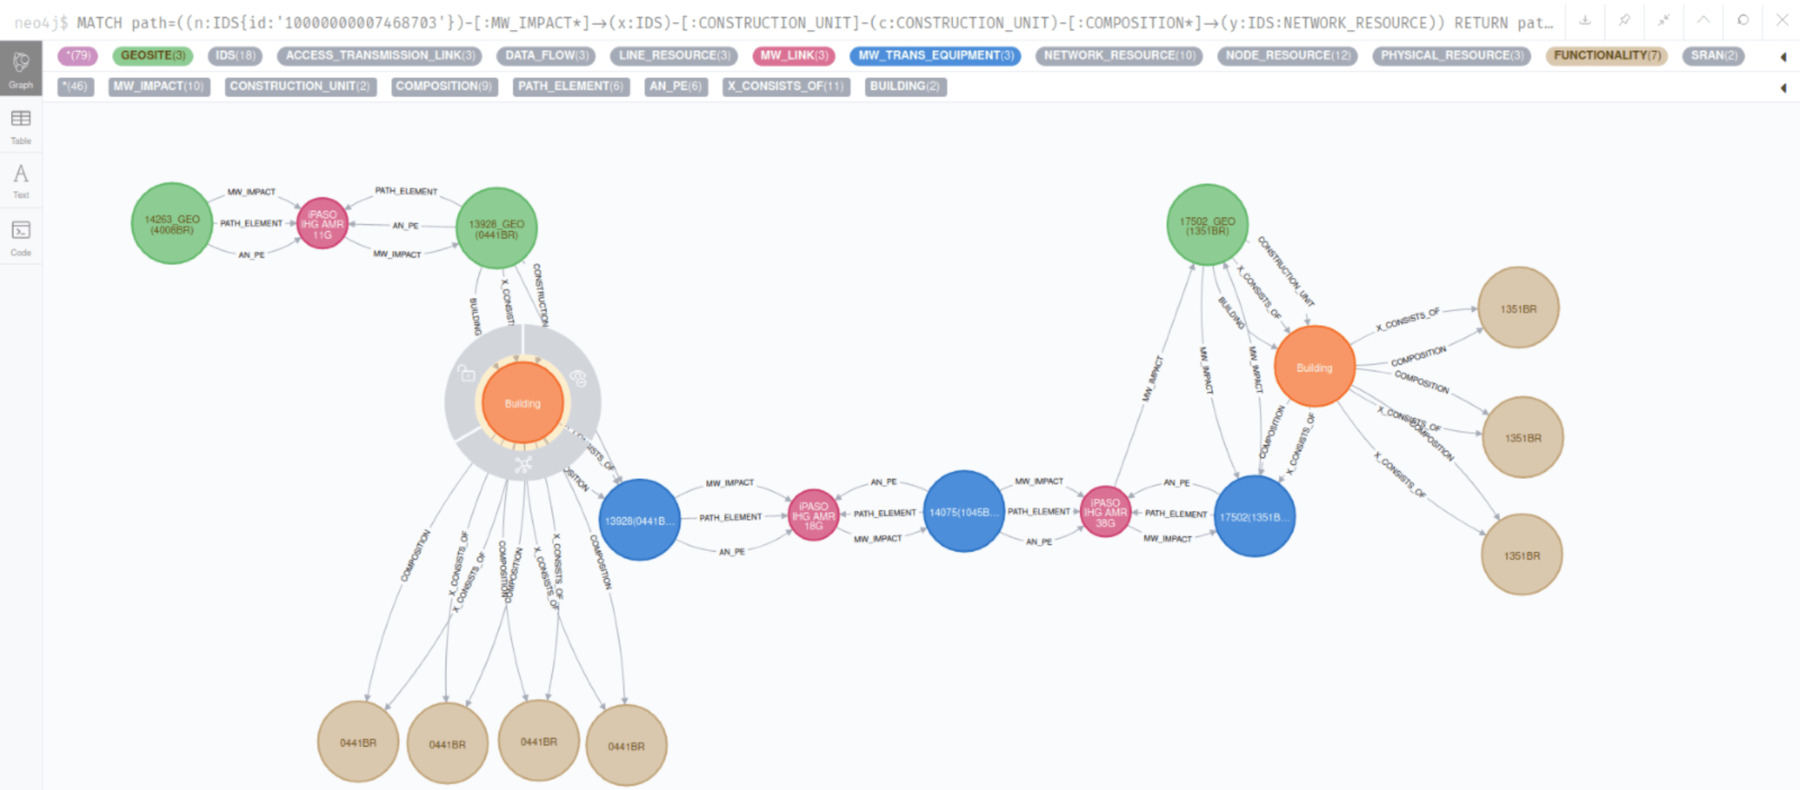

Find relations across huge graphs in real-time

Complete the missing data

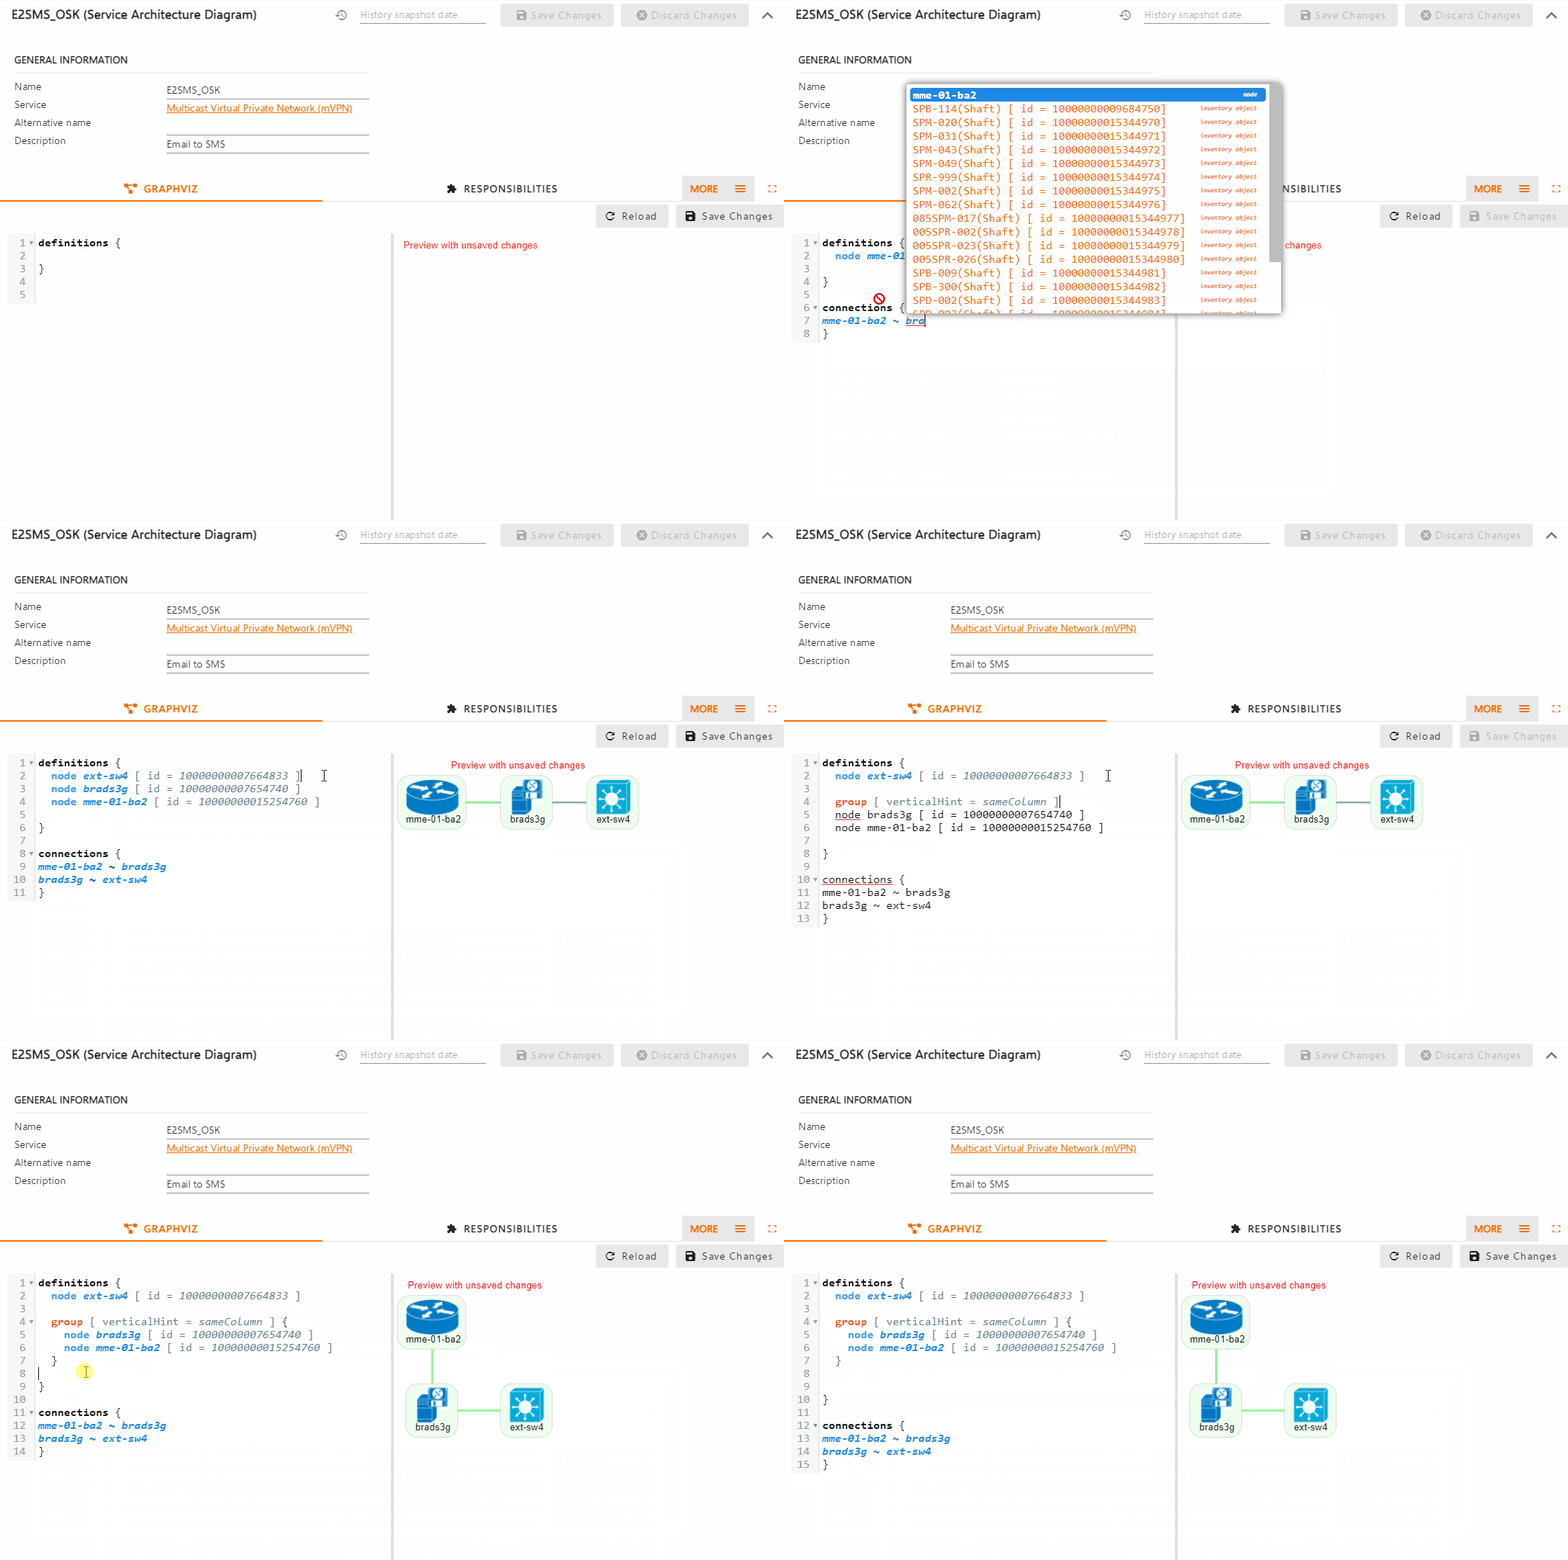
We had to adjust the implementation of our tool to not only show and analyze data integrated from other systems but also to allow the user to edit and further enhance this data. Part of the data which was missing is service architected which naturally has a form of a diagram. We have designed a specialized DSL (domain-specific language) that allows creating such a diagram very effectively from underlying inventory objects.

Complete the missing data

Impact visualization

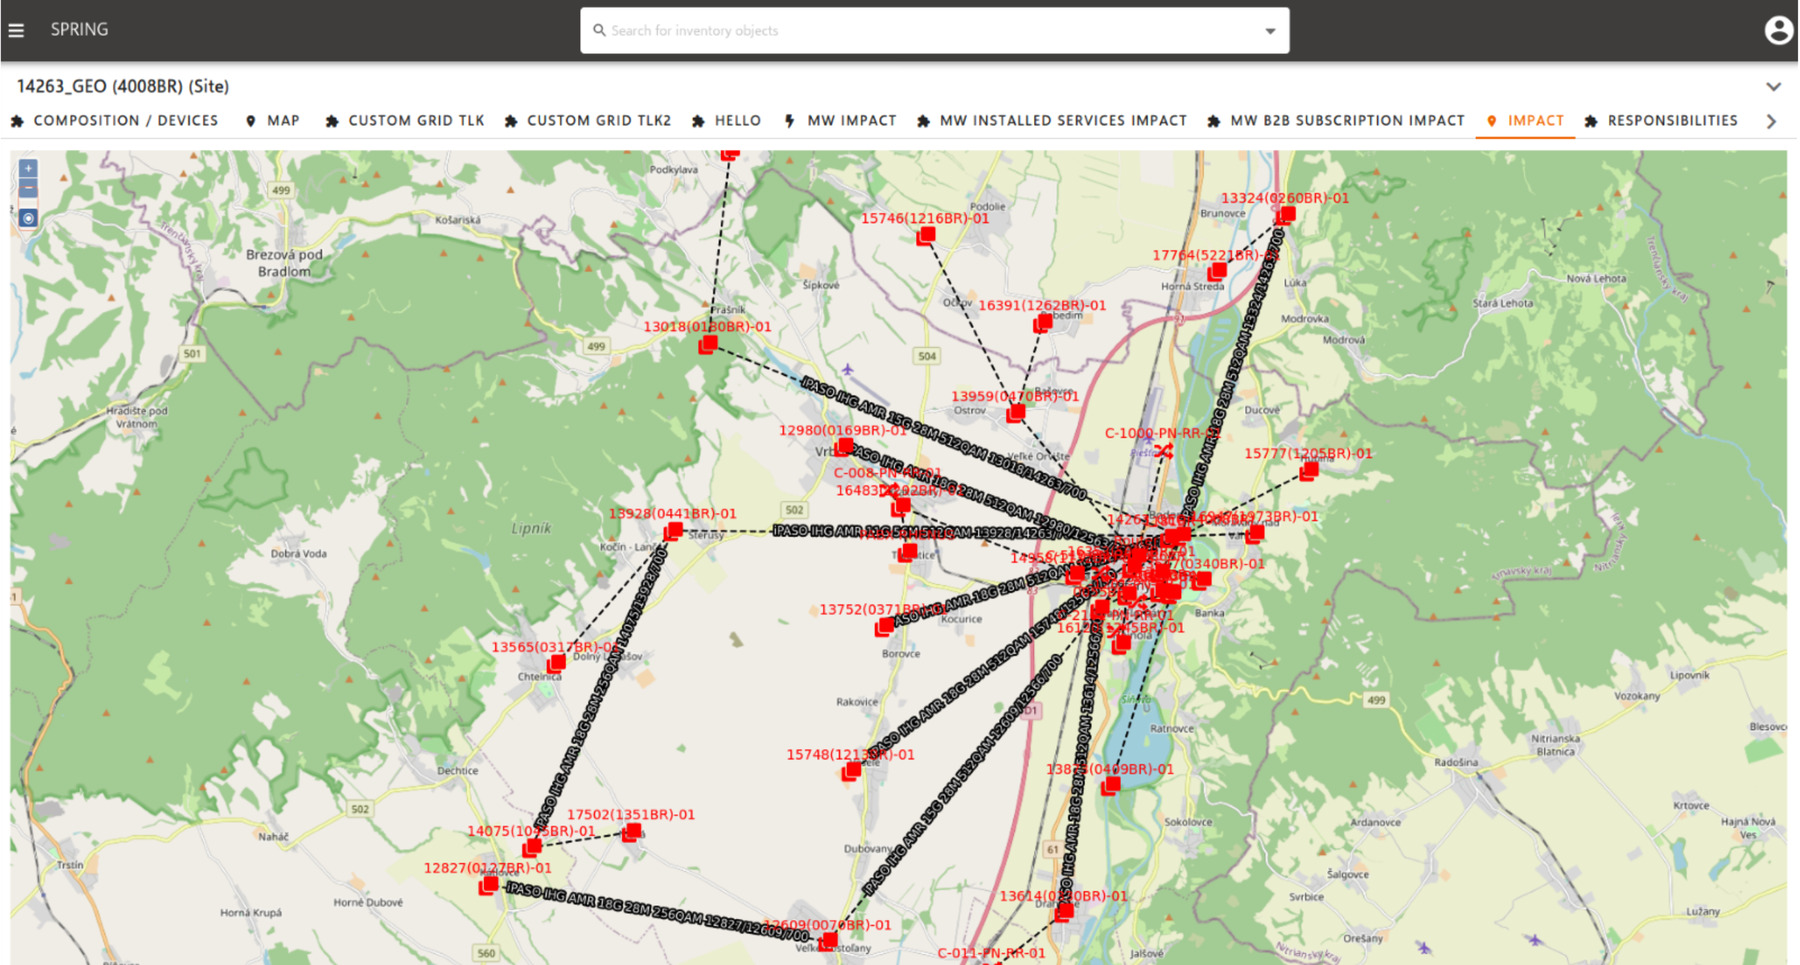
To give the user more information about the impact characteristics or reasons why the tool included some customers in the impact report we had to design specialized views on the impact data. For example, users can choose to visualize the impact on a map to see how the impact of one site outage will spread in the geographic space. Besides, users can visualize the full path from the specific customer devices to the network elements used by all customers for the given service.

Impact visualization

Key features

  • Data integration
  • Data modeling
  • High data volume processing
  • Microservices
  • Distributed applications
Is this for you?

When something breaks, you should know who it hits.

SIA answers this for Orange Slovakia: which services and customers depend on a network element. The same question appears wherever an outage or a planned change can ripple through a network of dependencies.

  • Telecommunications
  • Energy and utility grids
  • Data centres and IT operations
  • Transport networks
Sounds familiar?

0 of 5 sound familiar

How we would start

  1. Connect what you already knowInventory and network management data in one model, the way CELINE did it for Orange.
  2. Complete the gapsLet users edit and enrich the data where the source systems are incomplete.
  3. Answer the impact question fastReal-time search over the dependency graph and a clear report of impacted services and customers.
Know who an outage hits

Tell us
about your project

Describe what you want to build. We’ll get back to you within 24 hours with a proposal for next steps.

Need more info?

Reach out directly to our project managers, who will be happy to tell you more.

Romana Kovalová