Two ways to start an analysis
We implemented two input methods: manual input of customer identifiers, and automated integration with Zabbix via REST API to retrieve the list of affected customers directly from raised alarms.
RCA is an extension of the SIA application we operate at Orange Slovakia. While SIA assesses the impact of network elements on services and customers, RCA inverts the question: starting from the list of affected customers and their services, it finds what they have in common in the network topology — for example a shared fiber cable that is the likely point of failure after a cut. RCA was initially deployed to support FTTH (Fiber To The Home) services.
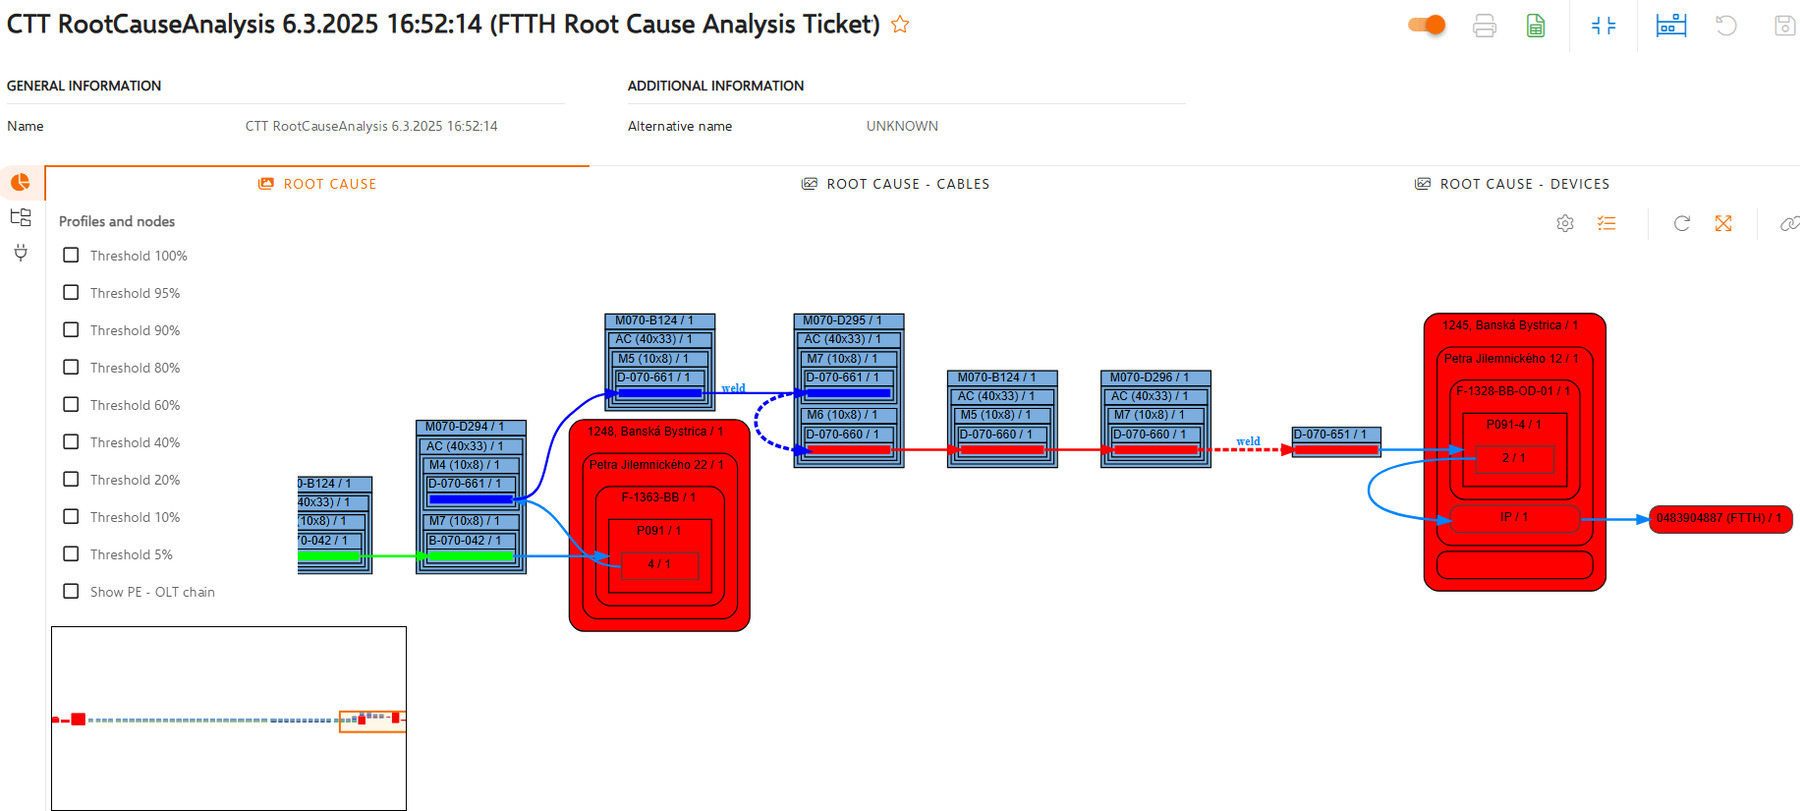
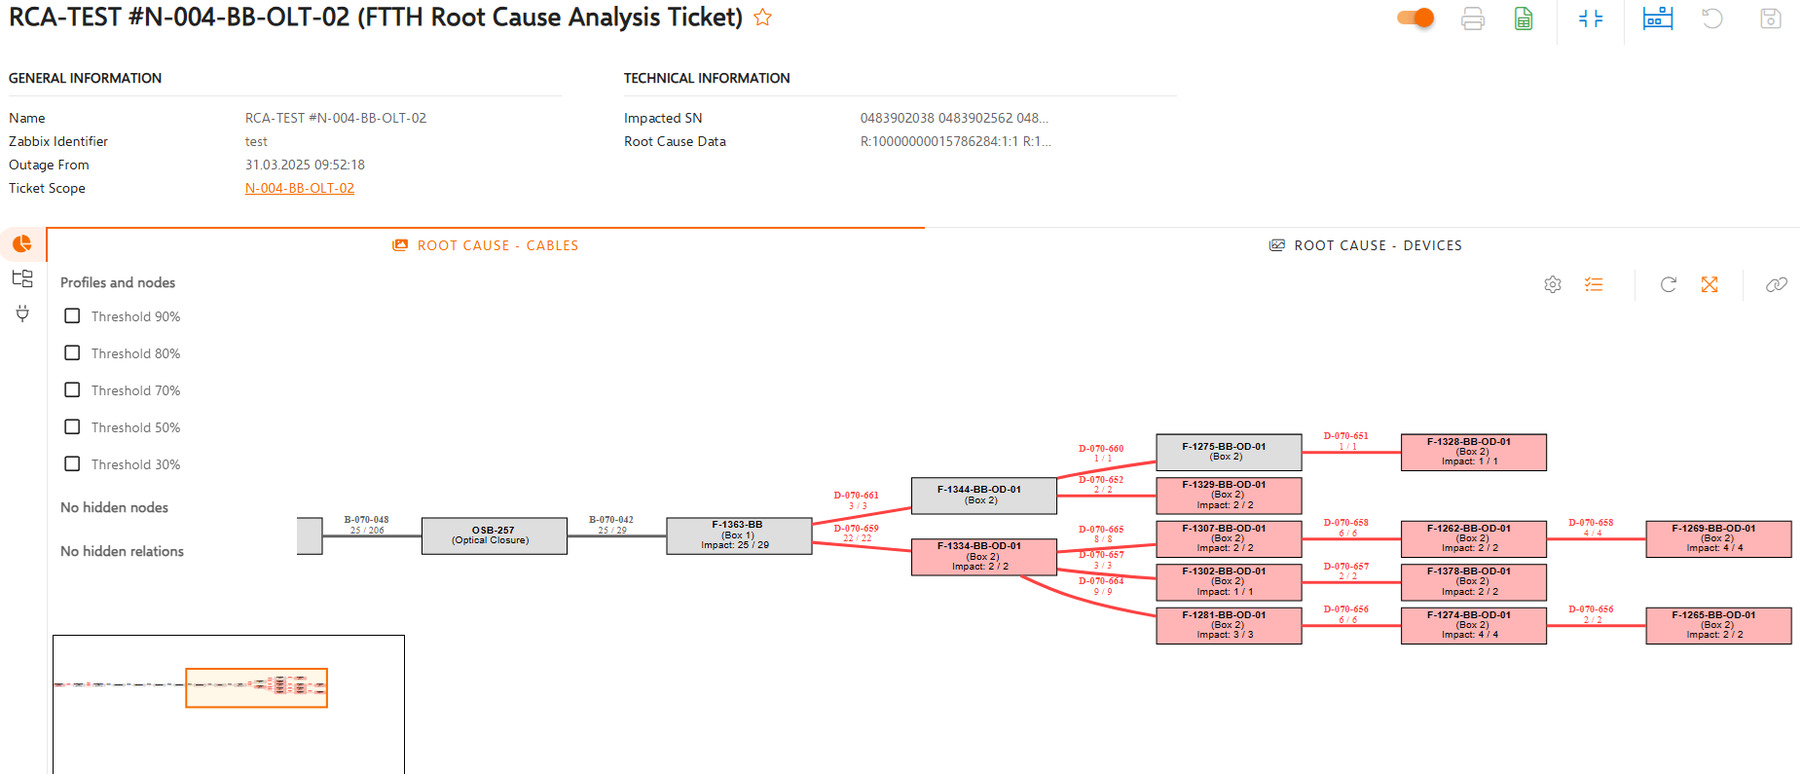
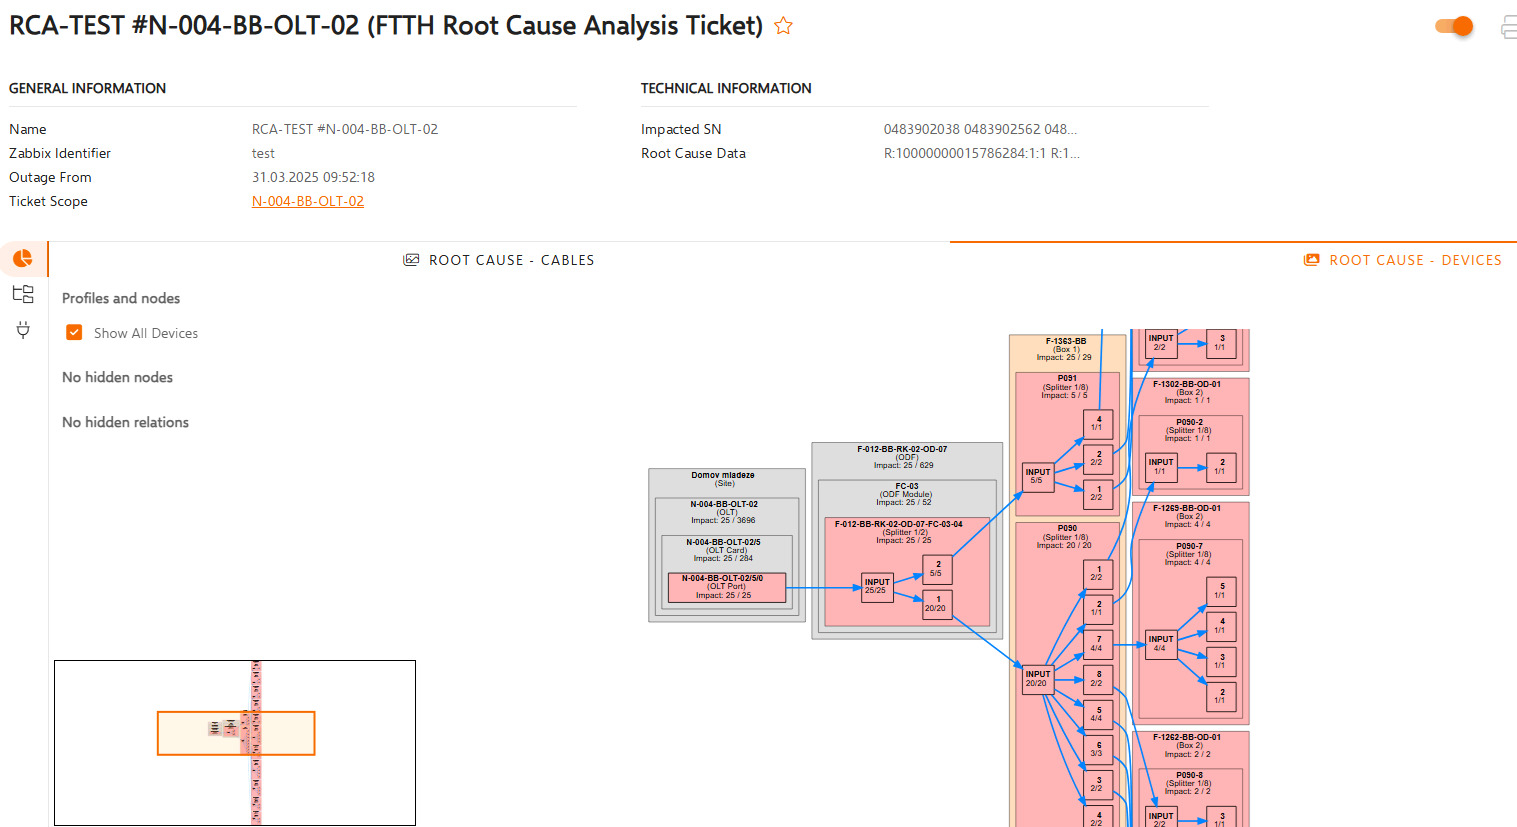
During an unplanned network outage, operators typically face a high volume of alarms, many affected customers, and numerous complaints due to service disruption. Identifying the root cause is often complex: for FTTH services the issue may lie in an active network element, such as an Optical Line Terminal (OLT), or in the passive infrastructure. If the OLT fails, the system usually raises an alarm enabling direct identification. A fiber cable cut, however, typically produces no direct alarms tied to the cable itself — only a large number of disconnected customers — so the operator struggles to pinpoint the exact cause.
The goal of RCA is to automatically identify the most probable network element responsible for the outage and present the result in a clear and actionable format.
SIA was already integrated into the Orange ecosystem — inventory systems and network management systems for RAN, DWDM, MW, SDH, and IP networks — and provided regularly refreshed and correlated inventory and configuration data. Finding the actual root cause of an outage, however, required a fundamentally different approach to analyzing the network topology.
To generate the list of affected customers automatically, we had to integrate with the Zabbix fault management system and reliably translate raised alarms into the set of customers and services behind them.
Not every batch of alarms belongs to a single outage. We implemented custom algorithms that group customers who share a probable root cause — if alarms originate from different regions or have significantly different timestamps, the system initiates separate root cause analyses.
The output had to be presented in a user-friendly interface that helps operators quickly identify the most probable cause of the outage and act on it — without studying raw topology data.
Outages can be detected either through customer complaints or via alarms in the fault management system, so RCA supports both entry points and takes over from there.
We implemented two input methods: manual input of customer identifiers, and automated integration with Zabbix via REST API to retrieve the list of affected customers directly from raised alarms.
The RCA algorithms analyze the full connectivity path of every affected customer and search for elements shared across all paths. For a group of FTTH customers, this typically reveals the common fiber cable that is the most probable point of failure.
The visualization layer highlights the shared segments in the network topology and displays the number of affected customers per segment. The operator can quickly locate the most probable section of the passive optical network where the fault occurred — for example a fiber cut — and dispatch the field team to the correct location for repair.
RCA finds the most probable failing network element for Orange Slovakia, starting from the affected customers. The same problem appears wherever one failure shows up as hundreds of symptoms.
We’ll add these to your message.

The DMS application is a centralized, web-based storage for all digital content; documents, photos, wiki pages, and decision trees.

CELINE is an umbrella inventory management system that gathers data from Orange affiliates on their network infrastructure and presents it in a unified way.

SIA is an evolution of our previous project CELINE which goal was the integration of various inventory data sources into one application.

Dodes is the abbreviation for Diagnostic nodes.